
Akshi Chawla
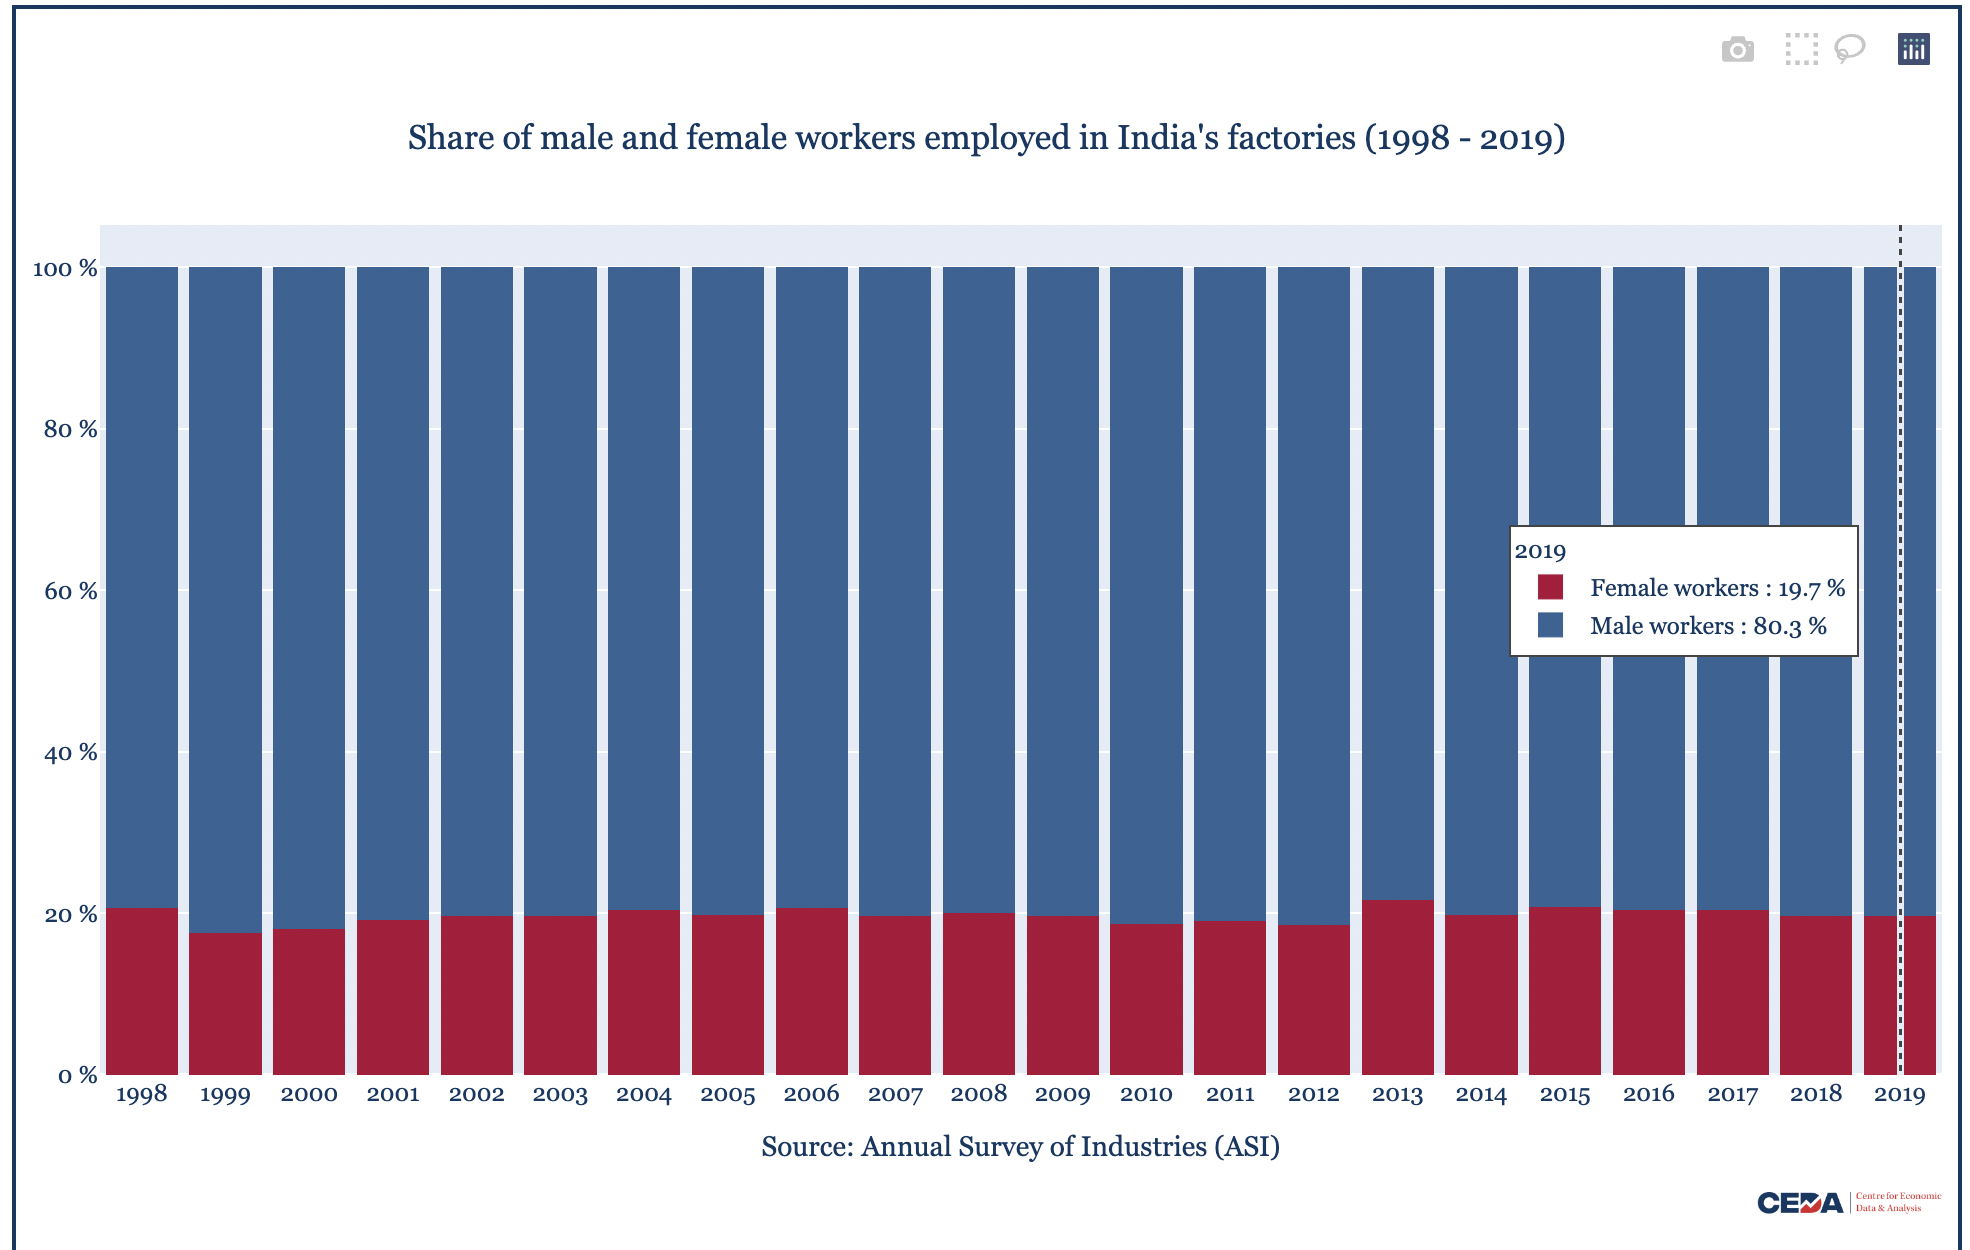 Share of male and female workers employed in India’s factories
(1998 - 2019)
Share of male and female workers employed in India’s factories
(1998 - 2019)
A few weeks ago, the National Sample Survey Office released data from the Periodic Labour Force Survey (PLFS). This is a routine annual publication that offers key insights into the state of employment in the country. Various media outlets reported on its findings – from numbers to more nuanced analyses. But many of them missed a rather glaring trend – that these patterns and shifts in employment were highly gendered.
Sample this: The share of women (aged 15-59) who were part of India’s labour force recorded a marginal decline between 2020-21 and 2021-22 (from 28.8 percent to 29.4 percent). In contrast, men’s labour force participation rate improved from 80.1 percent in 2020-21 to 80.7 percent in 2021-22.
There were more glaring differences. The share of women who were self-employed and unpaid helpers, has grown further significantly, unlike that for men. Similarly, certain analyses noted that the share of those employed in agriculture remained larger in 2021-22, as compared to before the pandemic hit, but again, many of these missed a critical detail. This too was a gendered trend.
The list of such diverging trends between men and women, as documented by the PLFS is longer. And yet, this indifference, to applying a gender lens to data analysis is almost a norm. It is habitual of experts to give gender a miss in routine analyses. Many unfortunately assume gender to be a niche and exceptional category of analysis.
You only need to skim through data analysis on a range of issues to know the extent of the problem – from elections, to employment, to banking and financial data, consumption, footfalls etc. But this gap comes with a heavy cost.
It is an oft-repeated adage among data enthusiasts that you cannot see (or change), what you cannot measure. The same is true of gender inequality. In the absence of gender data, it becomes very difficult to understand the scale of, or track inequalities, and even to monitor progress.
A gender-disaggregated analysis of factories data, for example, allowed us to identify that of all the women who work in India’s factories, 72 percent were working in four states (all in the Southern region) alone. Similarly, another analysis made it possible for my colleague Kanika Mahajan and her peers to
identify that wordings of job advertisements are often gendered, and those with preference for female candidates are likely to offer lower remuneration. The gender wage gap begins as job descriptions are framed, sooner than many of us would imagine.
The consequences of the missing gender lens to our statistics are serious. Data – the much celebrated “new oil” – if not contextualised for gender can lead to distorted interventions too. In her insightful book, Invisible Women: Exposing Data Bias in a World Designed for Women , Caroline Criado Perez documents how the absence of gender-disaggregated data ultimately leads to policies, infrastructure and systems that are designed assuming the default user is male. This consequently excludes women from “the very building blocks of the world we live in” adversely impacting their health and well-being.
At the Centre for Economic Data and Analysis (CEDA), which was set up in 2021 with the primary aim of facilitating informed debates about economic and social developments in India, gender remains an important lens for us across our work. Our data-based narratives and articles bring forth how socio- economic realities vary for different people based on their gender, and other identities; be it the wage gap, shifts in employment trends, representation in particular sectors, health and education outcomes, to shifts recorded by demographic indicators.
And we are not stopping at this – as strong advocates for the use of gender data, we also want to enable others to use such data. With this vision, we are building a gender data portal – possibly the first of its kind in the country – where we are bringing together gender-disaggregated data from a range of publicly available datasets in one place and processing this data so that it is easy to access, understand and use. We hope it will be able to enhance the data-driven rigour of the gender policy discourse in the country.
Akshi Chawla is senior programme manager and associate editor at the Centre for Economic Data and Analysis. Her work is centred around women’s representation in public life – particularly in politics, leadership positions and the workforce.
The Centre for Social Behaviour and Change team writes about building resilient systems, in the aftermath of the pandemic

Jyotirmoy Talukdar from the Centre for Writing and Communication writes about the Academic Bridge Programme